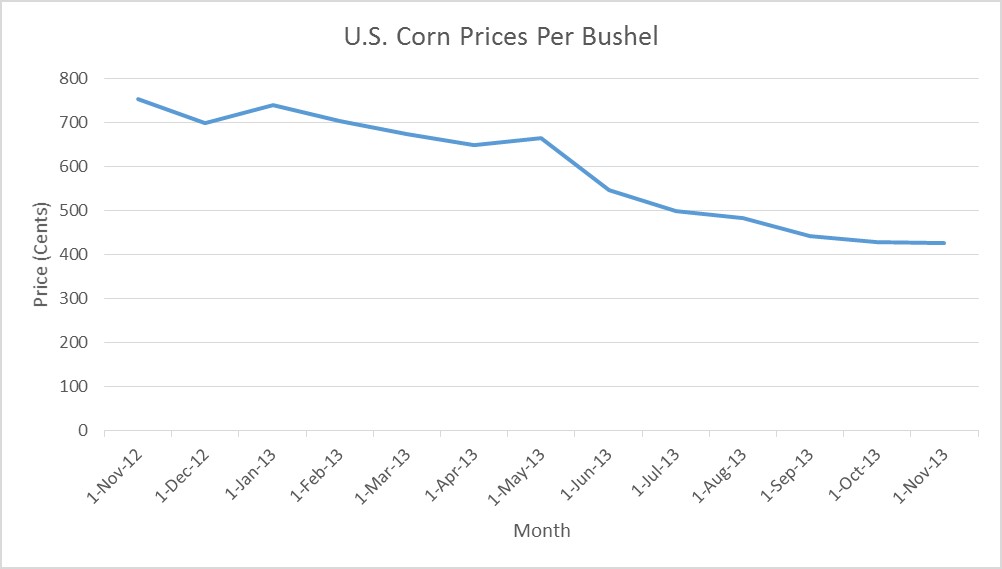
The past year has been a roller-coaster for U.S. grain prices across the country. The cold snap that spread across much of the Midwest in the spring often times covered fields in snow and ice, leading to a late start to planting, and as a result, crops that were late to mature. Despite these challenges, United States producers still turned out a record corn harvest, which had a significant impact on the market.
As with all crops, corn being “exhibit A” in 2013, grain prices will always come back to the fundamentals of supply and demand. From March through September, prices are strongly influenced by the market’s expectation of crop size, and USDA reports play a role in educating the market. As the year progresses, weather conditions and crop progress are closely monitored, leading into the fall harvest season when the true yields are realized.
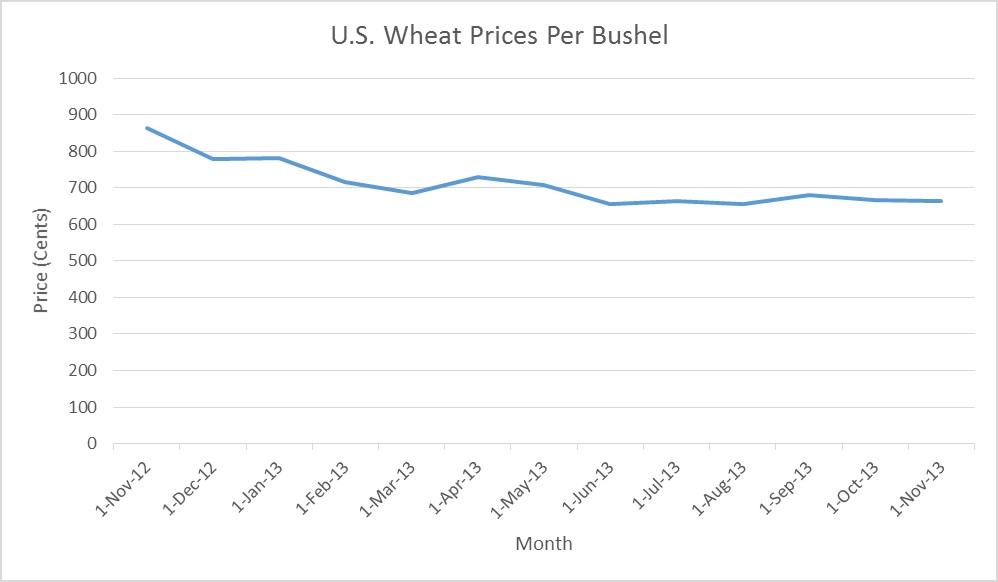
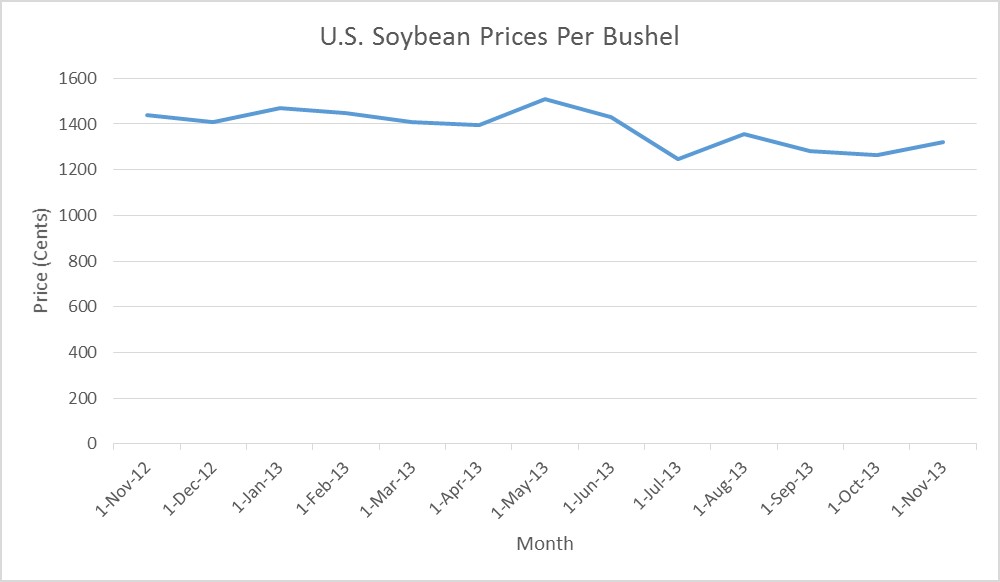
With help from Investing.com data, we have put together the charts below to offer a snapshot of the past 12 months of U.S. grain prices per bushel, and a visual look at the volatility of the grain market in 2013.
As we close in on 2014 and another year of crop production is around the corner, we hope this post provided a helpful visual look at the change in U.S. grain prices in the past year. If you enjoyed this post, or want to take a look at some others, feel free to connect with us on Facebook!


